The Oscar Bump
(Thanks to David Poland - @davidpoland - for tweeting about this NYT article and sparking the idea for this post.)
An article in this morning’s New York Times claimed several things about the current Academy Awards season. Some are more qualitative - like the claims of Mark Harris’ recent piece in Grantland - and can be argued back and forth as to their veracity. But some are purely quantitative - namely the idea that the Best Picture nominations have not done anything to bolster the box office success of the films.
There is a lot more analysis to be done here than I have time for, but here are two charts that show this year is not at all out of the ordinary, at least in the last 30ish years.
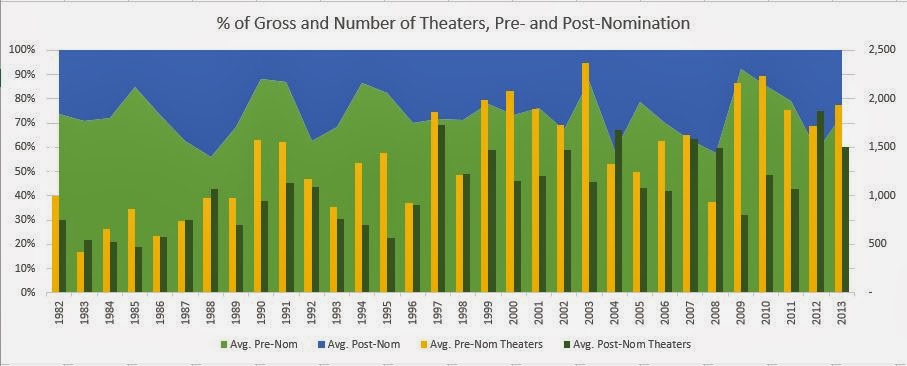
For these charts, I first took the box office of each film before nominations, and after nominations (but before the awards ceremony). I then took the pre- and post-nomination numbers for each film and made them a percentage of the total box office to that point (i.e., they will add to 100%) - so a measure of how much of the box office came before the nomination, and after the nomination - an approximation of the “box office boost” the New York Times attempts to analyze. I took them as percentages to account for the range of films that are nominated for Best Picture - Philomena has a very different box office outlook than Gravity , regardless of nomination, but taking a percentage allows for a comparison between the two. I then took those percentages and averaged them for each year - as always, averages smooth over specifics, but allow for easier analysis of trends over time. It’s not perfect. Finally, I showed the average number of theaters for those films in each year before and after nominations.
Guess what? It turns out if films are in more theaters, they will make more money (on average, anyway).
This is shown over time - from 1982 to 2013. It’s hard to see a real trend, but you can notice, for example, 2003 - a year in which, on average, the nominees made most of their money before the nominations - and, on average, they were in many more theaters before the nominations.
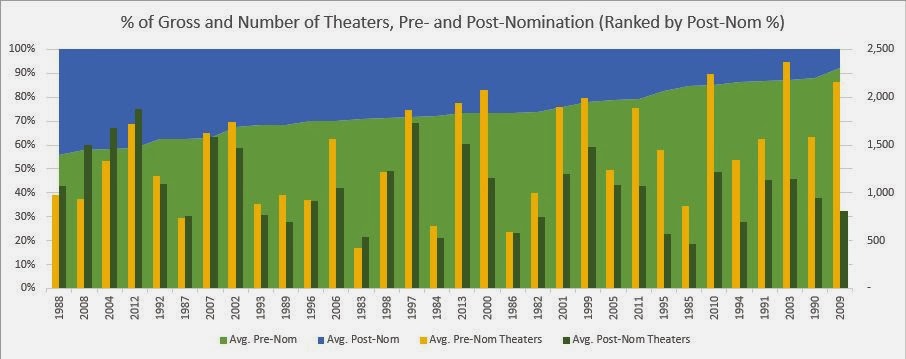
The second chart is, instead, ranked by the percentage of box office that came after nominations. Here’s the real trend - movies in more theaters before nominations than after will generally make more money before nominations than after. Most interesting and relevant to the NYT article - 2013 is square in the middle. Not to mention that the “post-nomination” period isn’t even over yet.
Again, this is a very simplistic analysis. Who’s to say that every one of these movies would have made the same amount of money, regardless of the presence of the Academy Awards? And what about date of release? Hopefully I can get to these soon.
(As always, the source is Box Office
Mojo. They have a seriously great
breakdown, year-by-year, of the Oscars and the box office. NYT, take note.)
__________________________
http://www.nytimes.com/2014/02/21/movies/awardsseason/oscars-best-picture- candidates-seek-box-office-bumps.html?_r=0