Will Anyone Watch Tonight's Oscars?
Claims are often made about why television viewership of the Academy Awards ceremony fluctuates from year to year - it’s the host, the films up for Best Picture, the number of films up for Best Picture, or various other reasons.
I chose to focus on one part of that - the films up for Best Picture - and analyze them based on their box office revenue prior to the ceremony each year. I stuck to the period from 1982 to today, due to the box office numbers being less consistent prior to that point, and to domestic box office and viewership numbers.
The first chart is just the TV viewership numbers for each year. There’s the household rating (the Nielsen rating), the household share, and the number of viewers. The distinction between rating and share is simple
- rating measures the percentage of total television-equipped households tuned into a program, while share measures the percentage of TVs actually in use at the time tuned into the program.

There’s a clear trend down - most noticeably in household share. This indicates that while a somewhat smaller number of people are watching the Oscars (between 35-50 million, with recent years hovering around 40), a significantly smaller percentage of total TVs that are in use at the time are actually watching the Oscars (from about 60% in 1983 to 36% last year).
The second chart has more information - it shows the box office revenue, up until the ceremony, for each of the films nominated for Best Picture. It is also, importantly, adjusted for inflation. Each bar represents the distribution of grosses - the start of the bar being the gross of the smallest film ( Nebraska this year) and the color separation (from black to yellow) being each successive film. The red line is the average gross of all Best Picture nominees in each year.

Here you see some more variation - years like 1982, 1997, and 2009 stand out considerably because of huge hits - E.T. , Titanic , and Avatar respectively. And years like 1984, 2004, and 2005 stand out in having no obvious outliers - and a considerably low average gross.
The final chart shows the year-over-year change of five numbers - rating, share, viewers, average gross, and highest gross.
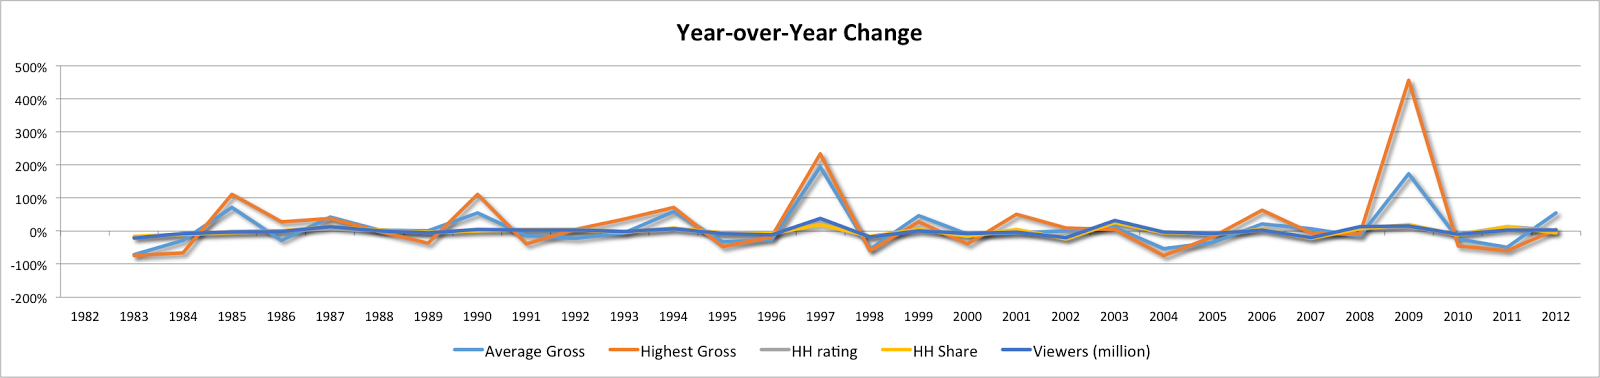
One important additional statistic for this chart is the correlation between the changes in average and highest gross, and the changes in viewership each year. The correlation is highest (64%) between the change in average gross and the change in viewership in millions of people. Put more simply, there is a fairly (though not hugely) significant relationship between the year-over-year change in average gross, and the year-over-year change in people watching.
Is it predictive? That’s harder to say - and maybe a topic for another time. But you can definitely see spikes in viewership in years (like 1982, 1997, and 2009) where the average gross is significantly higher - where there are bigger hits up for the biggest award. But to get back to the question of whether anyone will watch tonight’s Oscars - according to these numbers, fewer people will, given that, on average, the films have grossed less. But the average gross is only one number - maybe Ellen will matter more than anything else.
( Note: I am focusing on the numbers that I can gather. Changes in the type of viewership - online, On-Demand, etc. - are harder to account for. Which is not to say they aren’t meaningful - they are, in all likelihood, very meaningful and becoming moreso - but I can only analyze the consistent datasets that I can access.)