2013 Wasn't So Bad After All
Following the earlier post from today, here’s a quicker look at the box office from 1982 to 2013.
The first chart shows the percentage of total domestic box office, in each year, concentrated in the top 1, 5, 10, 25, 50, and 100 movies of that year.1
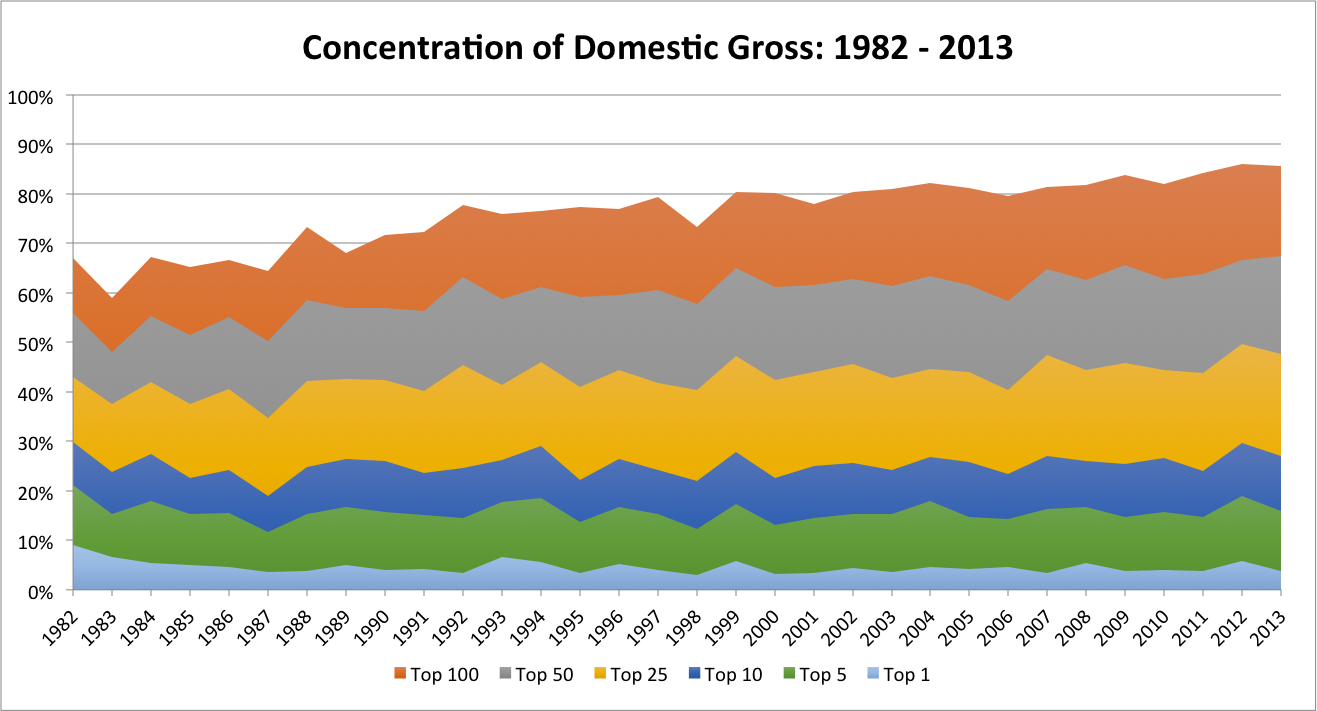
The first thing to note is that the top 100 movies represent a considerably higher proportion of total domestic box office - over 85% - than they did in earlier years. So while, as I noted in the previous post, there were far more movies released in 2013 than in 1982 - most of those extra movies actually represent a tiny portion of the box office take.

This is just the changes over time of the first chart, where 1982 is the baseline of 1 (100%). Most interesting is that the distribution of hits seems to be expanding over the years. Essentially, the top 1 and 5 movies of each year have represented less and less of the total domestic take, while the top 25, 50, and 100 movies have represented more of the total. The concentration of the top 100 movies, in particular, are over 120% of the concentration of the top 100 movies of 1982. If there’s one conclusion to draw from this, it’s that there are more and more worthy movies being released to the public - or, at the very least, studios and distributors are getting better and better at getting people to see specific movies (2013 being a great example - 31 different films crossed the $100 million mark, which may or may not still be a meaningful marker for success).
This is somewhat affected by an outlier in 1982 - E.T. - which represented 9% of all box office receipts in that year. Given the trend, it seems like no movie will ever top that. But I shouldn’t extrapolate - it would just take another movie as huge as E.T. , and another year as bad (at the box office) as 1982.
Note: Again, all stats taken directly from Box Office Mojo. __________________
1 It’s important to note that this data was taken as of December 31 of each year. So, for example, Avatar’s full domestic box office is not taken into account in 2009 - in fact, less than 40% of it is. As I wanted to keep this analysis to one of changes year over year, I felt it best to contain the gross within the specified year (not the full gross of a film released in that year). But I could see both sides to that argument. Additionally, I ran those numbers as well - E.T. is still at the top.